Marketers are increasingly shifting spend from traditional to online leads channels, in large part due to the data available for tracking campaign performance. As legendary thought leader Peter Drucker once said, “What’s measured improves,” and that’s exactly what marketing professionals are after.
There’s just one problem. Many don’t consider the big return-on-investment picture, at least that’s what research firm Software Advice discovered in a recent B2B Demand Generation Benchmark Study. The report showed marketers preferring digital channels that produce the lowest cost leads. This included things like social media, email marketing to a house list and SEO.
While this strategy makes sense, it doesn’t consider the quality or quantity of leads. Even if leads from a third-party generator might be more expensive, the percentage of contacts that convert might be far higher. Or, even though social media might rake in a ton of new contacts, you might end up with a database full of people that will never buy from you.
This strategy also doesn’t consider successes other than direct monetary return, such propelling the contact down the sales funnel. A different channel, such as “live demos with reps,” might have a higher conversion rate; but the lead would never have advanced to that point had they not previously watched a video or downloaded a white paper.
Here’s a list of charts showing the full survey results.
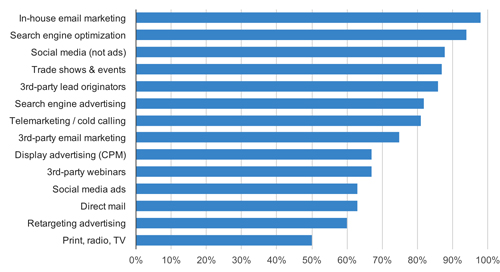
Popularity by Leads Channel
The graph below illustrates the percentage of marketers that use each channel for demand generation. It is ranked from most to least popular.
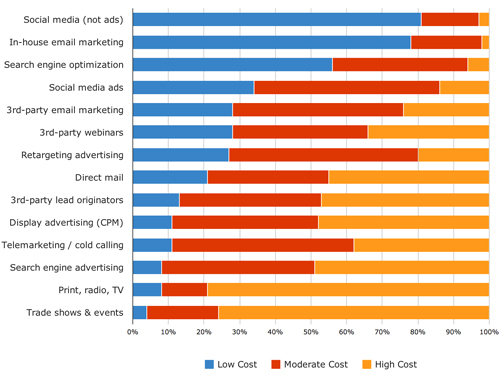
Lead Cost by Channel
We asked marketers whether they would describe each channel as having a high, medium or low cost-per-lead. It is ranked from lowest to highest cost per lead.
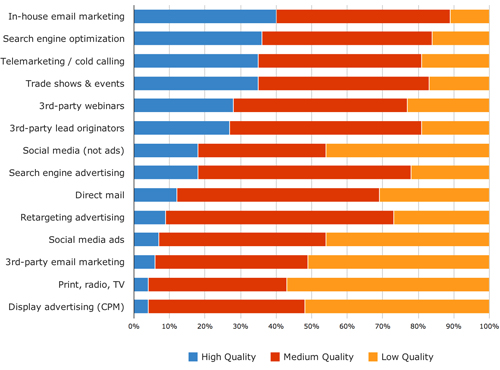
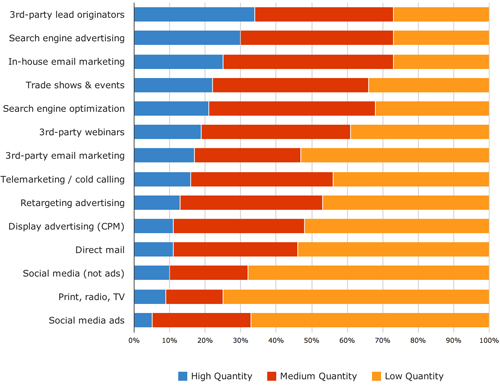
Lead Quality and Quantity by Channel
The charts below show whether marketers described each channel as producing a high, medium or low quantity and quality of leads. They are ranked from highest to lowest quality, and highest to lowest quantity.
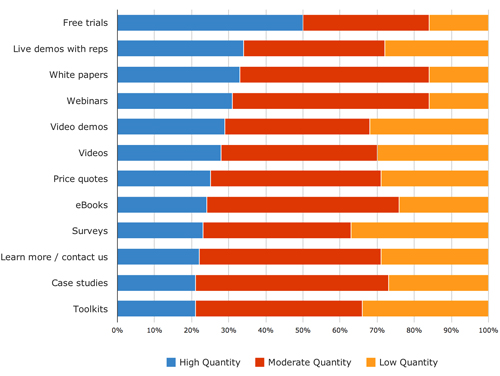
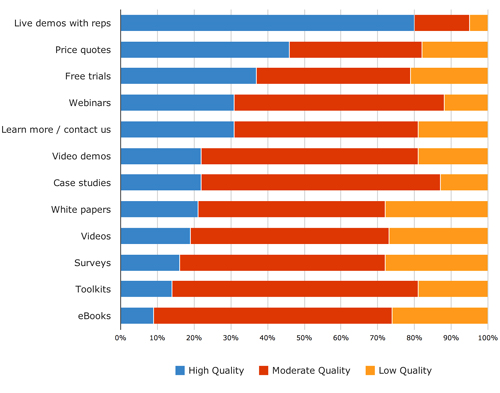
Lead Quality and Quantity by Content or Offer
The charts below show whether marketers described each content or offer as producing a high, medium or low quantity and quality of leads. They are ranked from highest to lowest quality, and highest to lowest quantity.
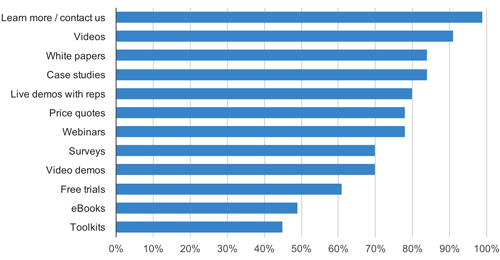
Popularity by Content or Offer
The graph below illustrates the percentage of marketers that use each content or offer for demand generation. It is ranked from most to least popular.
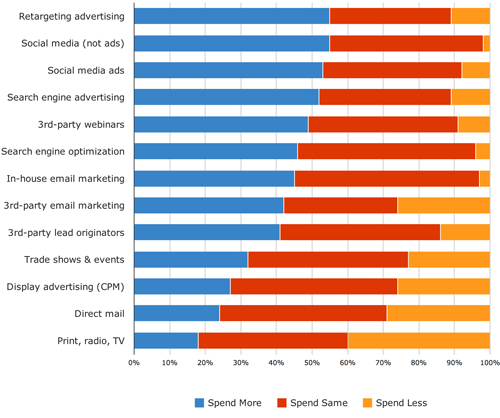
Spending Priorities by Channel
The graph below illustrates which channels marketers will spend more on next year. It is ranked from the highest to lowest percentage of marketers planning to spend more on that channel this year.
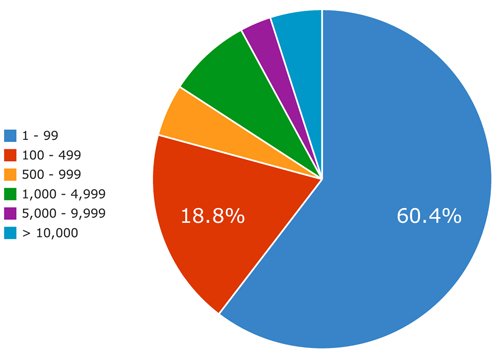
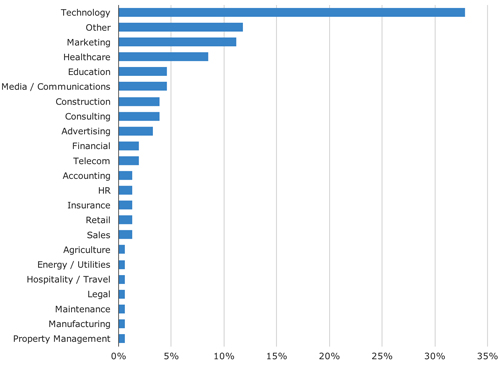
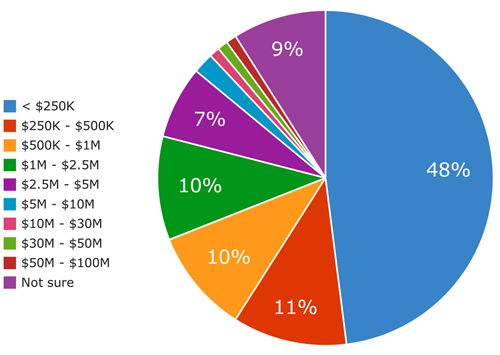
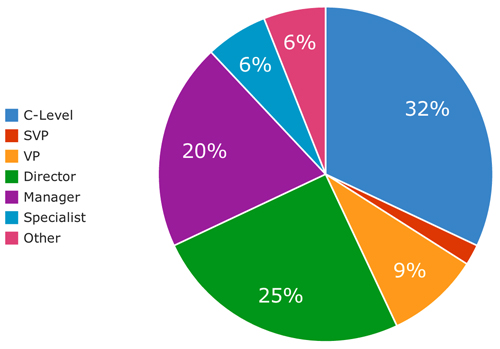
About the sample by industry, number of employees, marketing budget, seniority
We collected 155 responses from Sept. 26 to Nov. 12, 2012. Below is a breakdown of the sample by industry, business size, marketing budget and seniority.